CLIENT WORK • SPRING 2023
UX RESEARCH
DESIGN

IPA Dashboard

ENABLING GREATER OPERATIONAL COLLABORATION
TIMELINE
4 months
ROLE
UX Designer
SKILLS
User Research
Wireframing
Mockups
Prototyping
TOOLS
Figma
IPA dashboard screen
OVERVIEW
I worked on a team with a product manager and another UI/UX designer to design a PowerBI dashboard for Innovations for Poverty Action (IPA) as part of Harvard’s Tech for Social Good. IPA is an American nonprofit research and policy organization that conducts high quality research and evaluates the success of poverty-reduction programs across 22 countries throughout Africa, Asia, and Latin America.
THE PROBLEM
IPA Country Directors are the top-level management for each country in which IPA works . Their jobs include the oversight of operational processes, financial management, fundraising, new business development, and human resources. IPA would like to design a reporting setup in PowerBI that draws data from a variety of current and planned systems and presents the information in a rich yet easily-navigable format that combines metrics, alerts, and in-depth information for Country Directors.
HOW CAN WE BEST DESIGN A UNIFIED REPORTING PLATFORM
FOR KEY IPA STAKEHOLDERS?
THE PROCESS
We followed a research-driven, iterative process to ensure that we designed the right solution for IPA’s needs. This process involved comprehensive user research, wireframing, and prototyping.
Double diamond process
RESEARCH
User Interviews
We conducted 5 user interviews with stakeholders across a variety of roles within IPA including the Director of Colombia, Director of Global Research and Data Support, and IT Director to better understand the needs of IPA stakeholders, IPA’s current methods of data storage and visualization, and any limitations of designing a new Power BI dashboard.
WHAT DOES A POTENTIAL WORK DAY LOOK LIKE?
HOW DO METRICS INFORM YOUR WORK?
WHAT SYSTEMS DO YOU CURRENTLY USE TO ACCESS DATA?
Affinity Mapping
Based our user interviews and responses from a survey sent to more IPA stakeholders, we organized our insights into common categories.
IPA affinity mapping
Pain Points
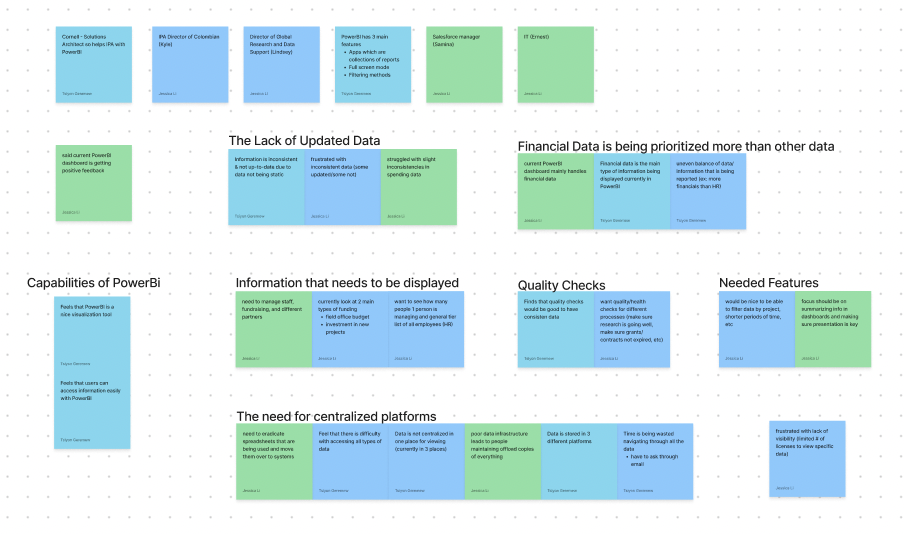
1. Inconsistent/Outdated Data
as a result of having multiple existing online and offline toolsets, there are often discrepancies in IPA’s data
2. Uneven Prioritization of Data
financial data is currently being prioritized and displayed, leading to difficulty finding data from other departments
3. Difficulty Accessing Information
visibility issues arising from limits to those who can input or view data
need for the “democratiz[ation of] sources and the ability to view them”
DESIGN
Lo-Fis
We focused on ideating on the critical friction points from our user research in our low-fidelity mock-ups. Our first iteration consisted of a Power BI App with three main pages — Country Overview, Projects, and Grants —, clear metrics, insightful graphs, and alerts/notification centers.
Country overview wireframeProjects wireframeGrants wireframe
Client Feedback
After showcasing our lo-fi designs to IPA and listening to their thoughts, we focused on two main goals for our high-fidelity mockups.
1. more filters to best splice and view detailed subsets of data
2. consideration and prioritization of the most important information on each page
THE SOLUTION
a centralized, easily-digestible dashboard for

1. faster decision making
2. more accurate reporting and data management
3. greater operational collaboration on shared metrics